IIT Kanpur Professor and his team announced on July 2 , the details of their study on COVID-19 new variants. Professor Manindra Aggarwal said SUTRA’s analysis of third wave analysis was done for three reasons. First, loss of immunity in recovered population. Second, vaccination induced immunity. Each of these two need to be estimated for future.
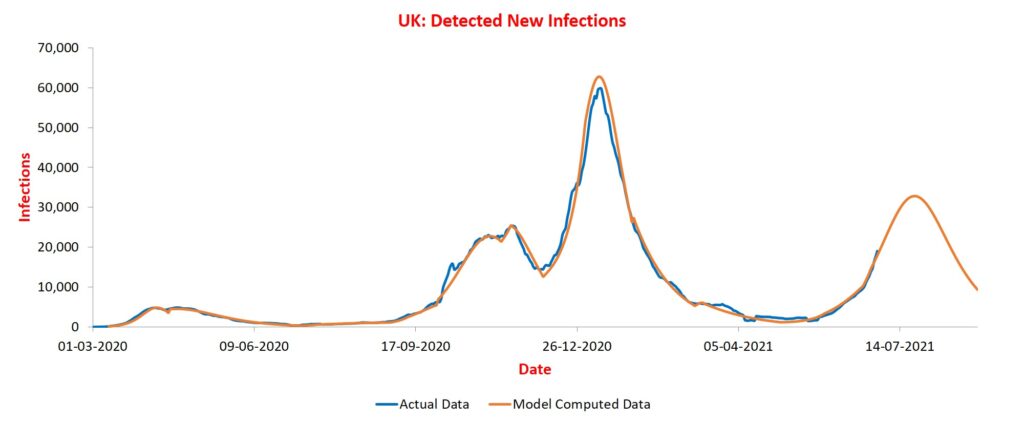
This is very similar to what happened for India in early April. The predicted peak kept rising but the timing hardly changed. For UK also, it is the reach parameter that is changing indicating significant vaccine-escape.
The potential third wave of COVID-19 pandemic will be “ripple” in the absence of any significantly faster-spreading mutant variant of the coronavirus, as per the projections of IIT-Kanpur’s ‘Sutra’ model.
However, if there is a faster-spreading mutant, the magnitude of the third wave of the pandemic would be comparable to that of the first one, as per the model.
In a series of tweets Maninder Agarwal, Professor at IIT Kanpur and a member of the team of scientists behind the ‘Sutra’ analysis, said the group has created three scenarios for the trajectory of the potential third wave of the pandemic.
As one can see, blue points are still drifting. I am no longer betting on when they will stabilize. The current plot shows a peak in second half of July around 33K infections/day.
As observed earlier, the current phase was in the drift period. I expected that it will stabilize soon, but it has continued to drift. The current phase plot is below. Notice that a phase change has been added — this was required due to continuous drift.
Professor Manindra says the third wave will be a ripple
So the bottom line is: if there is no significantly faster spreading mutant, third wave will be a ripple. And if there is such a mutant, third wave will be comparable to first one.
However, if there is an immunity-escape mutant, all the above scenarios will be invalid!
There is hardly any difference between optimistic and intermediate scenarios suggesting vaccine efficacy changes do not have significant impact. A faster spreading mutant has bigger impact as shown by purple curve. Even this is nowhere close to second wave.

Here are plots for the three scenarios. Blue curve is actual data. Orange one is model prediction until May. Dotted curves are three scenarios plotted from June.
Third is pessimistic one. This has one assumption different from intermediate one: a new, 25% more infectious mutant spreads in August (it is not delta+, which is not more infectious than delta).
We have created three scenarios. One is optimistic one. In this, we assume that life goes back to normal by August, and there is no new mutant. Second is intermediate one. In this we assume that vaccination is 20% less effective in addition to optimistic scenario assumptions.
“The optimistic one (scenario) – where we assume that life goes back to normal by August, and there is no new mutant. Second the intermediate one – where we assume that vaccination is 20 per cent less effective in addition to optimistic scenario assumptions. Third pessimistic one – This has an assumption different from the intermediate one: a new 25 per cent more infectious mutant spreads in August,” Agarwal added.
Then came imponderables. Will there be a new, more infectious, mutant? If yes, when will it strike? When will people abandon caution completely as in March this year? One can only make guesses, which may be completely wrong. Hence, it is better to compute a few what-if scenarios.
We went through the studies done in the past on loss of immunity and used conservative numbers for them. Similarly, we looked at the projected vaccination rate over next few months, included the effects of vaccine-hesitancy, and arrived at month-wise estimates for vaccination.
And third, how to incorporate the two in the model. Fortunately, it turned out that both can be incorporated by suitably changing contact rate and reach parameters. So that takes care of third one. First two required detailed analysis.


